The Visual Editor offers a graphical user interface to "build" dimensions and KPIs utilizing visual block representations of PQL statements.
Category Overview
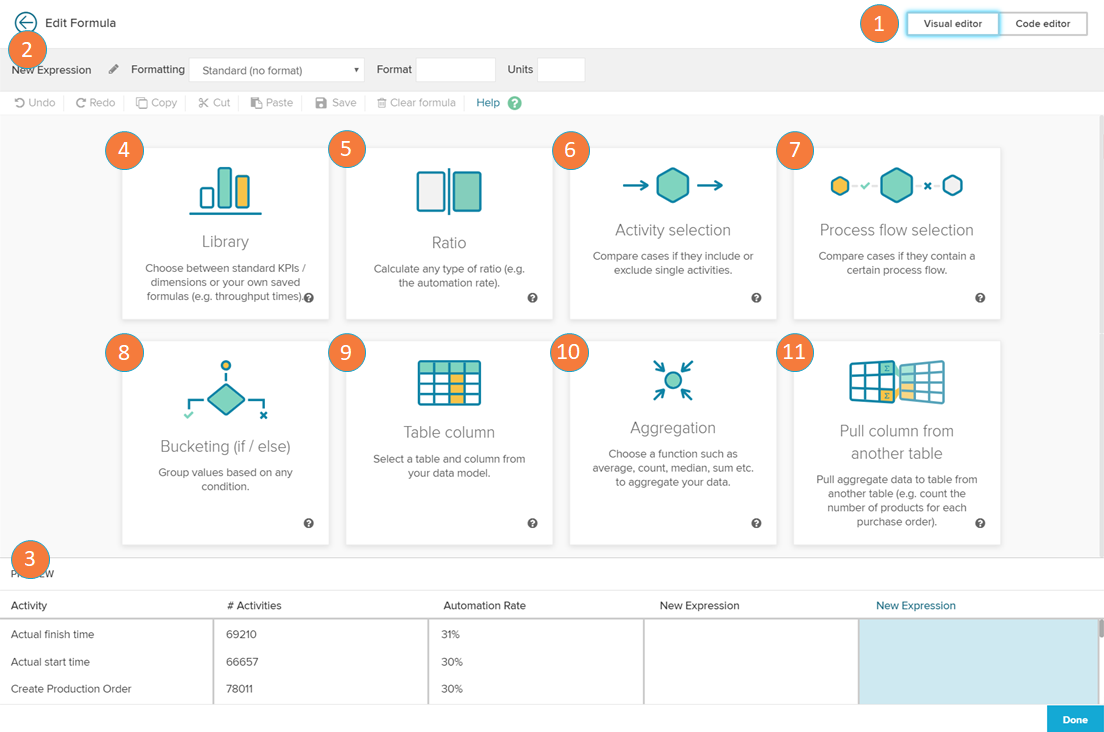
The first step after the creation of a custom dimension or custom KPI is to choose a category. This will create a template in the main area with recommended connections.
- Visual Editor/Code Editor toggle: switch between the visual editor and code editor views.
- Name and Format: alter the name and format of the KPI/Dimension you are building.
Preview: this section displays the preview of the KPIs/dimensions you have created
Below are the different category options:- KPI/Dimension Library: the library stores predefined standard KPIs/dimensions like the case count or the throughput time. It is also possible to save your custom formulas and re-use them from the library.
- Ratio: the ratio block calculates the ratio of values that fulfill a certain condition. The only input that is required to do that is the condition itself. A condition can be a column or aggregation that matches a certain value or any process filter. You can choose between a simple ratio, a activity ratio, a process flow ratio and a custom ratio.
- Activity selection: the activity selection block allows you to set a condition on the cases based on the activities they contain. You can specify if a case is flowing or not flowing through an activity or if a case is starting or ending with the chosen activity.
- Process flow selection: the Process flow selections allow you to set a condition on the path of the cases. You can define which sequence of activities the cases flowing through. This includes the possibility to define direct and indirect connections between the single activities.
- Bucketing (if/else): the bucketing allows you to split up your data according to a defined condition. You can set a condition on direct column values or aggregations. You can add multiple conditions to your formula and create as many buckets as you want. The conditioning can be used to calculate formulas based on the condition or simply label a dimension.
- Table column: the table column block allows you to add a column from one of the tables in your datamodel to the a formula.
- Aggregation: aggregations allow you to apply operations on your data.
The aggregations that are available are: average, sum, count, count distinct, count table, maximum, minimum, medium standard deviation, and variance. - Pull column from another table: the pull-up-function calculates the KPI on the table that was specified by the user. The calculations are therefore grouped on basis of the foreign key connection between the base table and the aggregated column. You can also set conditions on the calculation, so that only the data matching this condition is taken into consideration.
Formula Creation
Once a category is selected, the Visual Editor displays a formula creation screen with pre-defined template, according to your category selection. As you click on the template, it offers either functionalities or table columns to build up your formula.
If you have already selected a column or a table, the menu will offer the following possibilities:
- Change: choose another table or column.
- Add: with the functions listed at the Add section, you can apply operations to your column. This usually leads to the addition of brackets, to specify the new operation.
Please note, that the category templates are meant to support you. However, you can of course edit or rearrange each of them to support your requirements.