The Pivot Table is a data processing component to show an KPI based on a minimum of two dimensions to apply sorting, averaging or summing of data. The component can be used to show information on a KPI in multiple levels and identify bottlenecks at first glance with common Celonis table settings.
General Overview
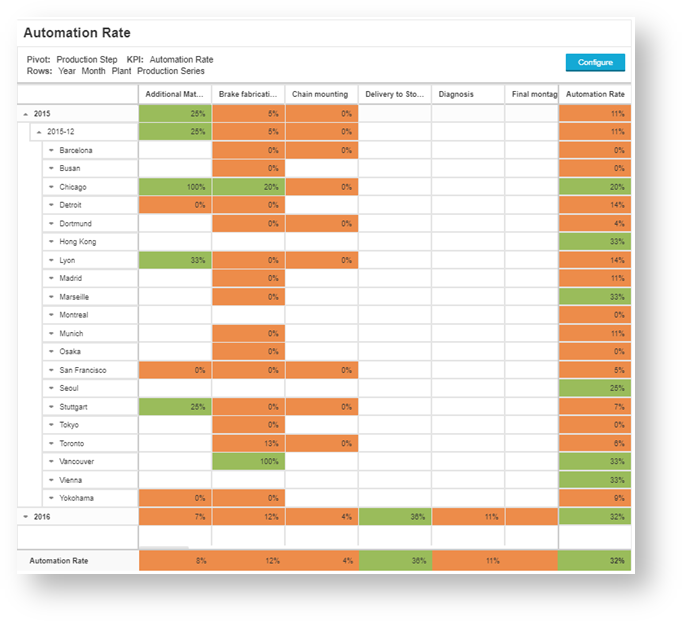
KPI
The selected KPI is displayed based on the selected dimensions. Multiple KPIs can be chosen and prepared by the analyst and the viewer can change between the KPIs under “Configure”
Dimensions
The dimensions are the basis for the rows and columns of the pivot table. The pivoting element is selected and can be changed in “Configure”.
Summaries row (bottom) and column (right)
The selected KPI can be added to the table and show the aggregated data
Colour Mapping can be applied in the settings to easier navigate through the data
Main Functionality & Settings
- Dimensions
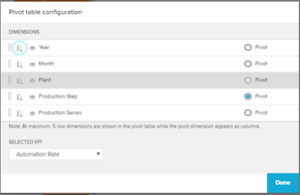
To use the pivot table at least create 2, (best 3) dimensions. The dimensions are defining the Pivot Dimension and the rows shown in the table. - KPIs
The pivot table can only show one single KPI. Note that flexible switching between different KPIs can either be done under Configure (4) or by the use of variables. The selected KPI can also be added to as summary for each row and column. - Pivot Dimension and Selected KPI
The pivoting element will define which dimension is used for the columns (4), the same applies for the selected KPI. For initial set up of the pivot table the first dimension and KPI in the list (1)(2) are selected automatically. The maximum number of pivoting elements that can be shown is 80. - Hierarchy
The hierarchy shown in the rows of the pivot table is defined by the order of the dimensions in the settings and can be adjusted by the user under Configure (4). - Summary of selected elements
The summary above the pivot table shows which pivoting element (“Pivot”), which KPI (“KPI”) and which dimensions (“Rows”) are selected. The maximum number of rows is 5.
| Info |
|---|
Note: It is not possible to directly filter on a KPI. It is possible to select any pivoting element and any row. After one selection, the the pivot table is reloaded. |
Configure Modal
- Configure Modal
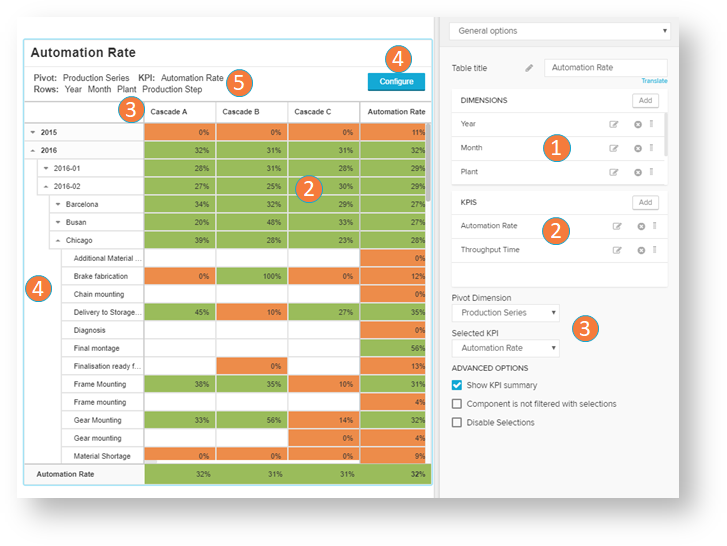
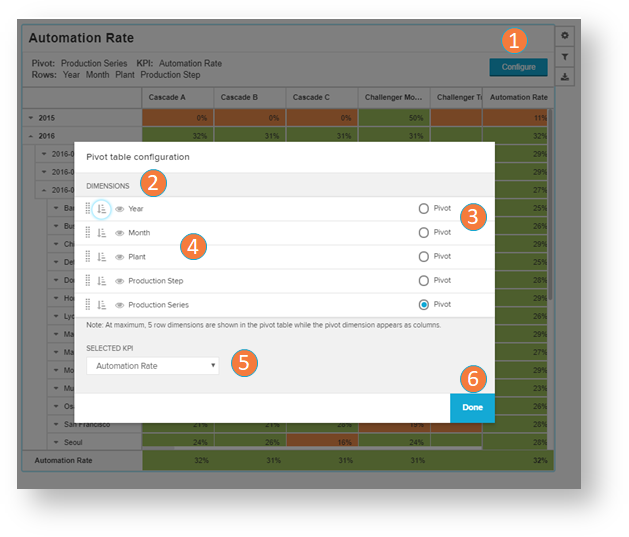
By clicking on Configure (1) a modal is accessible both for analysts and viewers. The user is able, once the pivot table is set up, to flexibly adjust the pivot table configuration. Adjustable are the pivot element, the row order and the selected KPI. Common Celonis features like sorting and visible/invisible functionality are also included. - Dimensions
The dimensions are listed with one of them is the pivoting element (3) which can be changed. The order of the other dimensions defines the hierarchy of the rows (4). The hierarchy can be changed with drag and drop and is defined with the first dimension in the list (which is not the pivoting element) is the 1st level row. The rows can be sorted and made invisible or visible. The maximum of the rows is limited to 5 and the pivoting element to 80.
- KPIs
The pivot table can only show one single KPI. Note that flexible switching between different KPIs can either be done in the dropdown menu with a minimum of one KPI has to be defined for setting up the pivot table.
Done
By clicking on Done (6) the changes are applied and the pivot table is reloaded.