Structure and navigation
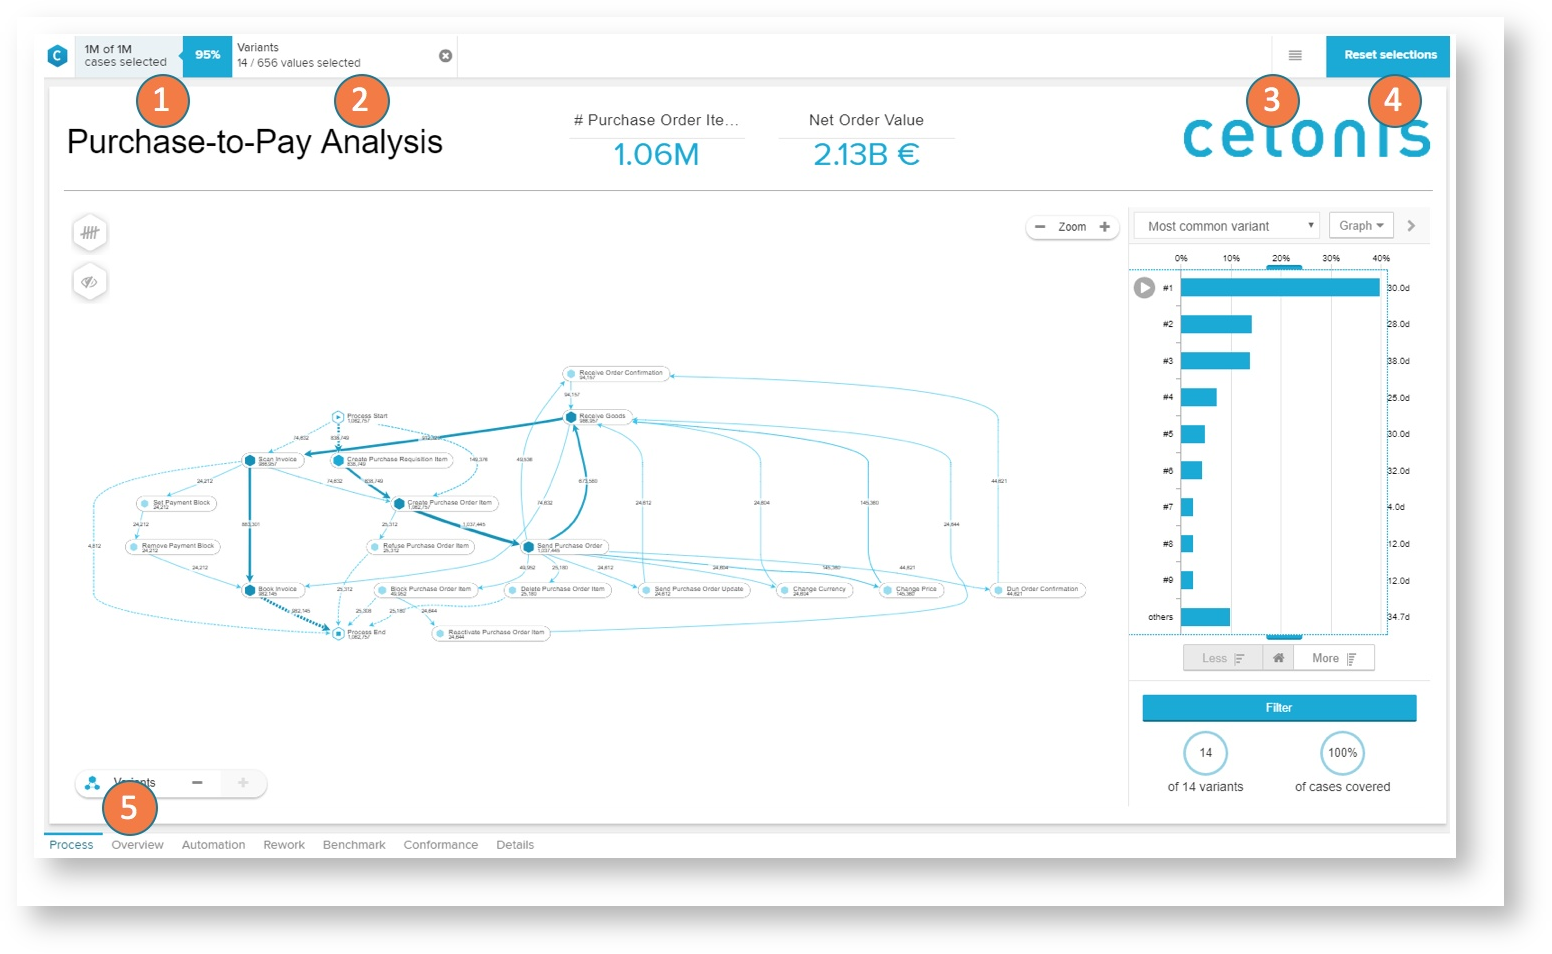
- The case coverage at the top left shows you how many cases of the total dataset are currently selected
- The selection bar shows you which single selections are currently active on the analysis.
- The burger icon provides access to the analysis options.
- The reset button allows you to reset your current session. This will remove all current selections and resets the analysis to its original state.
- Analyses are structured in single sections. Those sheets can be navigated at the bottom of the view.
Analysis options
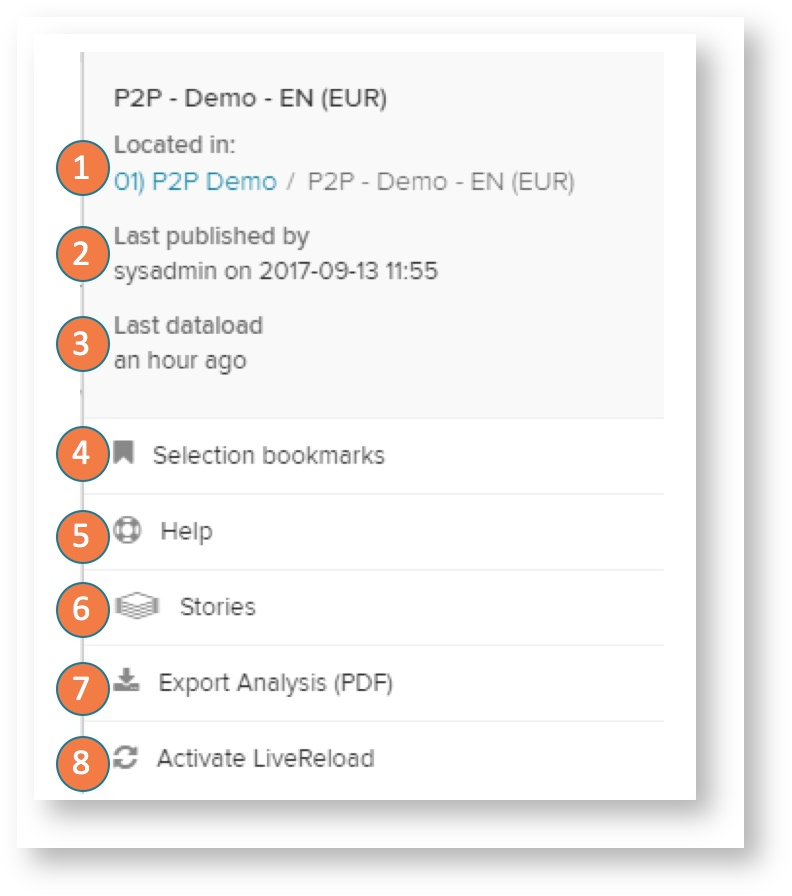
- Location: See the project, folder or subfolder in which the currently opened analysis is located.
- #Last published: This information shows you which user last published a new version of the analysis and when this version was published.
- Last dataload: Here you get shown when the last data load was executed.
- Selection bookmarks
- Help: Here you can open a help modal with access to the manual, service contacts, etc.
- Stories
- Export analysis (PDF): This option will export all sheets in the analysis in one document.
- Activate LiveReload: This option will switch in a live refresh session. The analysis session will be refreshed each 30s (can be changed in the URL) and update to the new data. New data points are automatically shown in the charts and visualizations.
In contrast to the live refresh mode, in general the user session is kept until you explicitly reset your selections with the reset selection button at the top right or reload the page.
The analysis is kept in the current state for each user to allow exploration of the interesting cases without interrupting the discovery phase on the process data.