The Graphic Editor is the base for any operations that are performed with the data in your data model. It gives you a graphical map of all tables with their foreign-key relations, which link the single tables of a data model together.
To use the tables for an analysis in CPM 4, you need to define relations by using primary - and foreign keys.
Graphic editor components
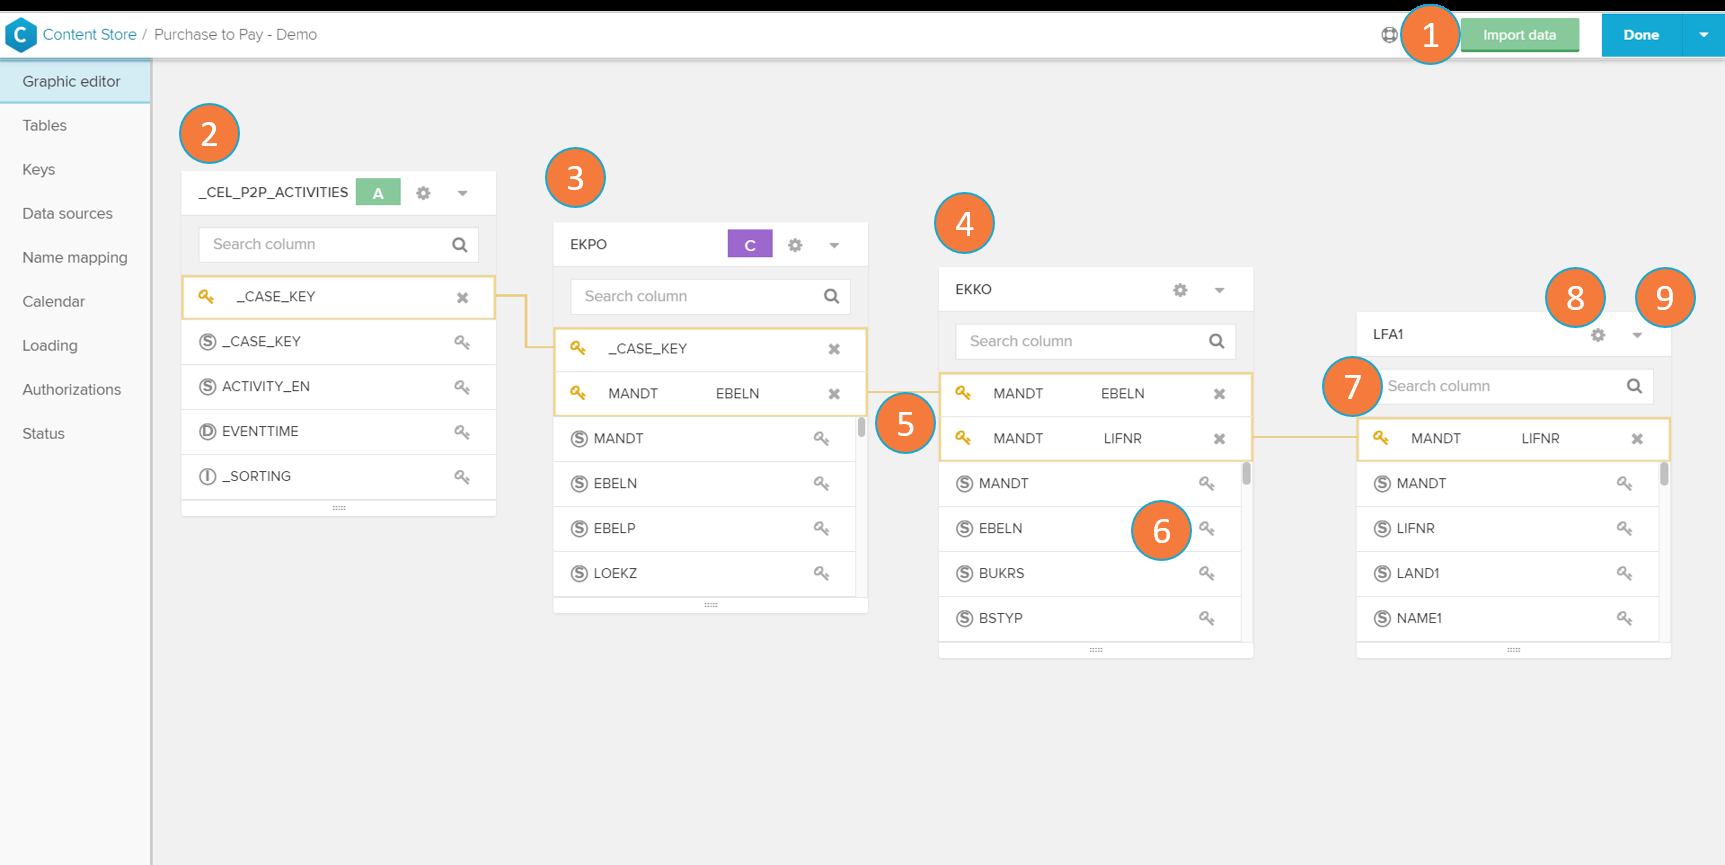
The Graphics Editor shows your current connected tables and allows you to assign the relations between them and which of their columns you which to display. You can also freely move the tables with Drag & Drop without affecting their relations.
- Import data: add new data tables to your analysis (see the Importing Data section).
- Activity table: activity tables are the basis for your Celonis analysis. They contain the necessary columns of 'Case key', 'Activity', and 'Event time'. Activity tables are identified by the
 icon.
icon. - Case table: case tables contain all information about your cases in the event log. They are identified by the
 icon.
icon. - Data table: other raw tables containing relevant information associated to your analysis. Raw data tables contain no icons.
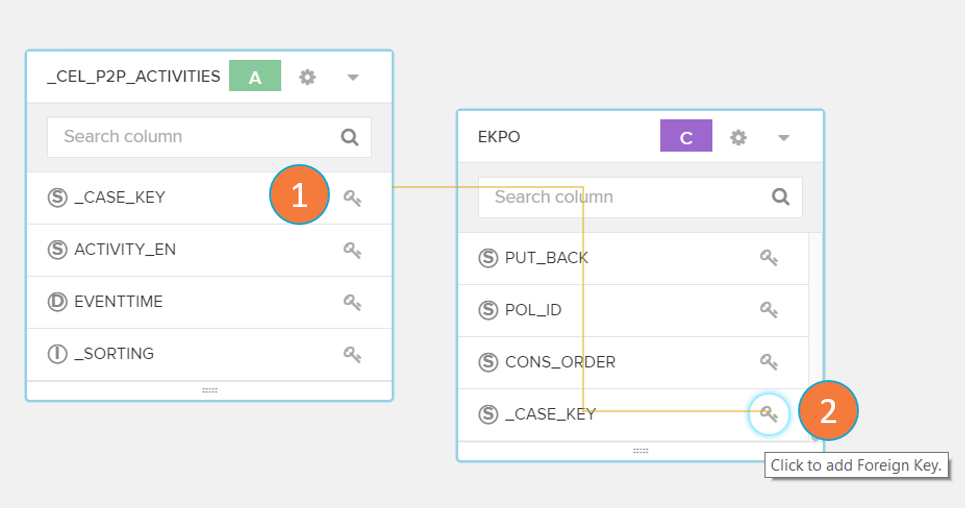
- Foreign keys connection: the golden lines represent the foreign keys used to connect your data tables. search for activities and data models in this and on other project folders.
- Add new foreign key connection: click on the key icon to start the foreign key connection process.
- Search column: use the search field to look for a key column.
- Settings: click on the settings icon to open the table's properties (see Tables section)
- Expand/collapse icon: click on the icon to show (or hide) all available columns and to graphically assign foreign keys.
Define keys in graphic editor view