DECISION_TREE
Applies to: CELONIS 4.3 CELONIS 4.4 CELONIS 4.5 CELONIS 4.6
Description
Create a decision tree, learn classification rules based on training data, and use it to classify new data rows.
Like other machine learning functions (such as linear regression or k means), the Decision Tree consists of two steps.
The first step consists of training the decision tree model. This will learn the classification rules of the decision tree (see https://en.wikipedia.org/wiki/Decision_tree) based on the provided training data. In this step, the user can specify which columns the model should use, and on which subset of the data the system should be trained on. Additionally, an extra max_depth parameter can be provided in order to avoid overfitting to the training data.
In a second step, once the model is trained, the user can use it to classify new rows based on the model input columns.
Syntax
DECISION_TREE ( TRAIN_[FILTERED_]DT ( [ EXCLUDED ( table.exclude_column, ... ), ] INPUT ( table.input_column, ... ), OUTPUT ( table.output_column ) [, max_depth ], PREDICT ( table.predict_column, ... ) )
TRAIN_DT: Constructs the decision tree. Authorization objects are still respected.
TRAIN_FILTERED_DT: Constructs the decision tree, filtering the training data with current filters.
EXCLUDED: These are dimension columns (columns that are not aggregations) that should be used as grouping columns for the INPUT columns of the model training. These columns will be ignored by the training algorithm and won't be part of the trained model.
INPUT: One or more columns, which is used to train the model.
OUTPUT: One column containing the labels associated to each row that the model should train upon.
max_depth: Default=3. This specifies the maximal depth allowed for the learned tree, this can be used to prevent overfitting. If max_depth=0, no limit will be set on the depth of the tree.
PREDICT: One or more columns, should be semantically the same as the ones provided as the model INPUT parameter, contains the class assignments based on the trained decision tree rules.
All columns in TRAIN_DT have to be joinable. The columns in PREDICT do not have to be joinable with the columns in TRAIN_DT.
The input of the model training is regarded as an independent sub query. This means if an aggregation is used, it is independent of the dimensions defined in the rest of the query. This also means that the columns within TRAIN_DT have to be joinable, but not with the columns used in the rest of the query.
Filter behavior
Standard Decision Tree
If rows of a column are filtered, it does not affect the decision tree, as long as the decision tree model is not trained on aggregation results. This means independent of filters and selections, the underlying model stays the same. If you want to restrict the input data of a model you can use a CASE WHEN statement and map the values you want to be ignored to null.
If a model is trained on results of an aggregation it still changes with the filtering because the result of the aggregation is affected by the filtering.
Filtered Decision Tree
If a filter or selection changes, the model is retrained and the resulting function adopts to the new of view of data. This has a serious performance impact.
Result
The Decision Tree splitting rules are constructed to reduce the entropy within subsets of the data created at each splitting point.
User Interface
Here is the configuration panel for the decision tree component. The Target Column field corresponds to the OUTPUT and the Features to the INPUT query elements previously described.
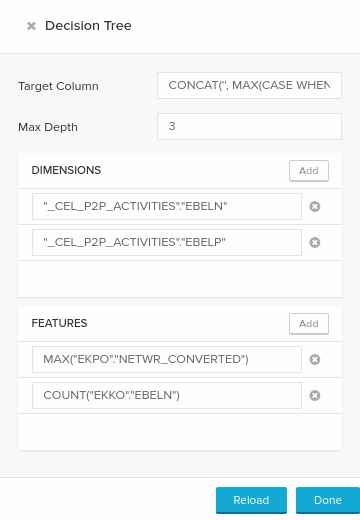
Decision Tree user interface
This is the tree displayed by the decision tree component configured with the above configuration screen
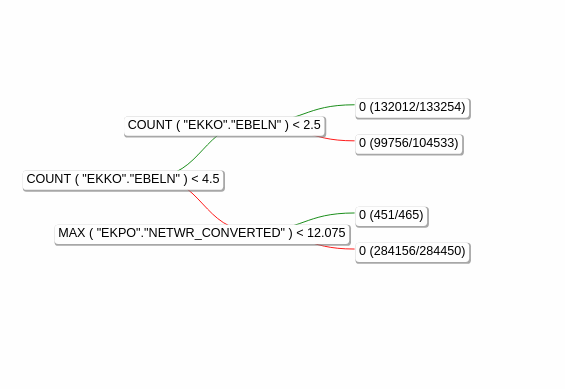
Decision Tree example
This visualization helps understand the model that was built from the classification problem and thus give new insights to the data being analysed. Each of the rows (defined by the provided dimensions, or Case if no dimension is provided) will flow through this decision tree when being classified, following the green or red path at each rule of the tree depending on whether it satisfied (green) or does not satisfy (red) the decision rule displayed in the box.
The leafs of the tree indicate the class being assigned to the row reaching it. The numbers in parenthesis are statistics about the performance of the decision tree on the training data, the denominator indicates the total of rows that have reached the node, and the numerator indicates how many of the rows that have reached this node were classified properly.
As we can see in this example, every row is classified as being of the class 0 which can be explained when looking at the number in parenthesis, indicating that this is done because of a sur-representation of the class 0 in the training data, leading to best performance when assigning the 0 label to each row.
Example
[1] A simple example for a decision tree. |