How to improve analysis performance in CPM4
We distinguish between three types of performance problems:
An analysis is constantly or very randomly slow.
An analysis is slow if it hasn't been touched for some time (> 1 hour).
Opening an analysis is slow.
For each type of performance problem, there is a different approach to address it.
An analysis is constantly or randomly slow
Please check, if the CPM4 server follows the sizing guidelines. If that is the case, please contact a data scientist who can asses the analyses and possibly provide optimization recommendations.
A warning sign for an undersized server are log messages like the following in the CPM4 log ($CPM4_HOME/logs/*stdout*):
2019-10-02 23:01:00 INFO SchedulingService - Memory available 16383 MB, Memory used 15535 MB
2019-10-02 23:01:00 WARN SchedulingService - Memory is to 94 % full.
2019-10-02 23:02:00 INFO SchedulingService - Memory available 16383 MB, Memory used 15579 MB
2019-10-02 23:02:00 WARN SchedulingService - Memory is to 95 % full.
An analysis is slow after it hasn't been touched for some time
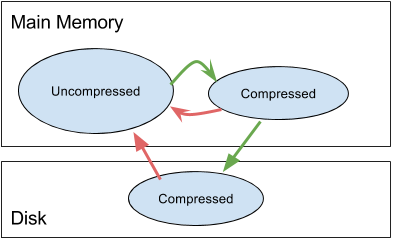
In this case, changing the cache retention configuration can improve performance. CPM4 swaps data to the disk, which is not used for a specific amount of time. It applies a two-level swapping approach. Firstly, after a specific amount of time, the data is compressed but kept in memory. That reduces the memory footprint, but the data can still be accessed relatively fast. Secondly, after the data has been compressed in memory and not being accessed for an additional amount of time, it is written to disk, to further reduce the memory footprint of CPM4. Accessing the data from disk is rather slow and often the root cause for lacking performance.
 |
The time between the last access of the data and the in-memory compression or swap out to disk can be configured in the data model editor (See screenshot below). Both settings can have a significant impact on the performance and the memory footprint of CPM4. The swap-out times should only be increased if the CPM4 server has more main memory available, than needed in peak times. Depending on available resources, we recommend increasing the thresholds in small steps. We also recommend focussing on the disk swap out time, because disk access is usually costly.
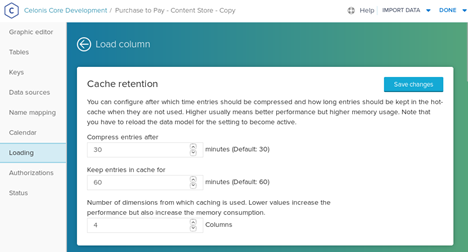
The "Compress entries after X minutes" field, configures after how much time data is compressed, but kept in memory. The "Keep entries in cache for X minutes" describes after how much time after the last access, the information is written to disk.
Opening an analysis is slow
If opening an analysis takes particulary long, while drill-downs provide a decent performance, query caching can improve performance. The query cache stores the result of queries that have a long execution time. If the same queries are requested again, they can be answered out of the cache at a very high speed. That technique is especially helpful for opening an analysis, because in that state no user-specific filters are in place. The chances that the requested queries are cached are high because somebody opened the same analysis.
Unfortunately, it is not possible to cache every query result because the system would run out of memory. Therefore the cache size is limited and an eviction strategy is in place. After extensive use, meaning sending many queries of a data model, entries may have to be deleted from the cache. That is why an analysis which opens slowly is an indicator that the query cache is too small.
The query cache is warmed up as part of a data model load to avoid a bad user experience after the load. To prevent long data model loading times, the time spent on the query cache is also limited.
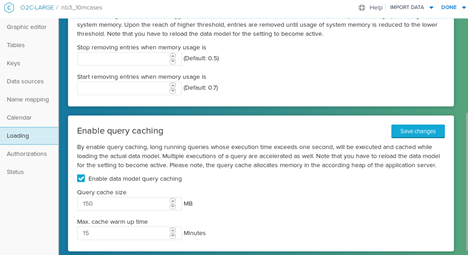
Both limits, the query cache size limit, and the query cache warm-up time limit can be configured in the data model editor. If you experience performance problems while opening an analysis, check if query caching is activated. If that is the case, increase the limits. If the query cache size is increased, increase the cache warm-up time accordingly. You can get more information about the state of the cache by querying the following endpoint:
|
The result looks like the example below:
|
The fields have the following meaning:
cacheSizeInBytes - Maximum size of the cache. It corresponds to the configured query cache size.
cachedQueries - Number of queries that are currently cached.
evictedCache - Did the cache had to delete entries because it runs out of space.
cacheUsageInBytes - Current size of the cache.
The result of the endpoint shows only the current state of the cache. To validate if the query cache warm-up time is set appropriately, the state of the query cache after a data model reload is relevant. An only partly filled cache after the warm-up is an indicator that the warm-up time is to low. You can get the post-warm-up query cache status after the past reloads by calling the following endpoint:
|
The endpoint returns a list of query cache statistics. Each item represents the query cache state after the query cache warm-up.
|