Process components
Celonis process components visualize your 'as is' process in Celonis analyses.
Process Explorer
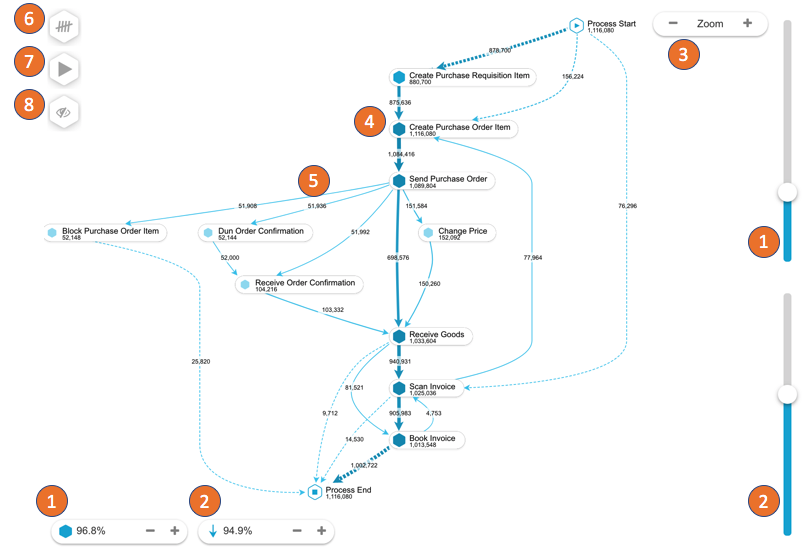 |
The Process Explorer initially shows the happy path.
Add and remove single activities.
Add and remove edges.
Zoom in and out on the process graph.
Click on activities to select all cases flowing through, not flowing through, starting or ending with the activity.
Click on an edge to select all cases with or without the edge.
Switch the KPI shown on the Process Explorer.
Start the animation.
Hide and show single activities from the process.
Happy path
The happy path calculated by Celonis shows you the algorithmic path in your process which is taken by most of your complete cases in the event log.
The happy paths show you the most frequent starting activity and the most frequent ending activity, as well as all edges and other activities that are included in the variant connecting those two.
Process Explorer animation
 |
 |
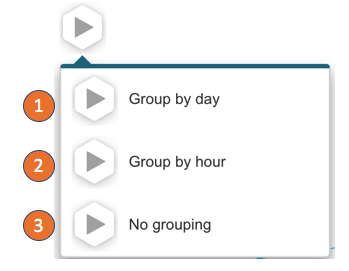
The process animation can be started at the top left of the Process Explorer. You can:
Animate the cases grouped by day.
Animate the cases grouped by hour.
Animate each case individually. (Limited to max. 1000 at once. Filter down to activate on large data sets).
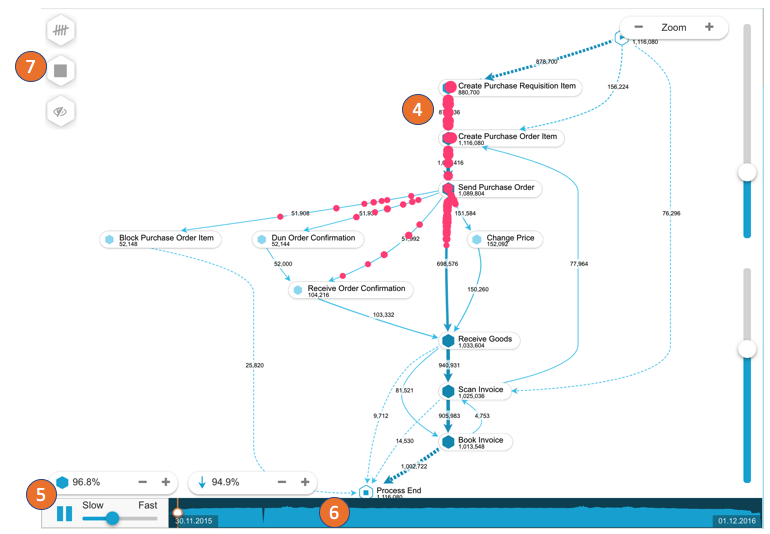
The cases are shown in pink bubbles and move according to their throughput time.
The animation can be stopped and its speed defined.
The current position in the eventtime can be selected.
The animation can be stopped.
Variant Explorer
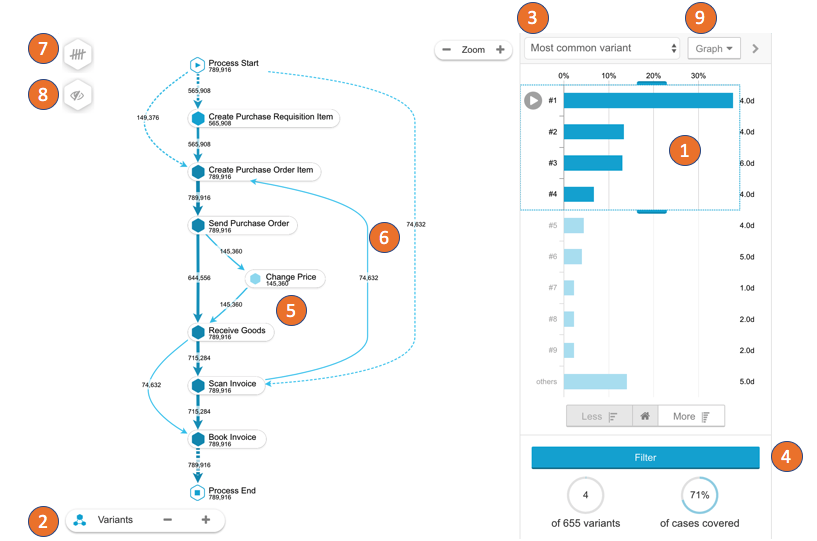 |
The Variant Explorer will show all process variants within the event log. You can control which variants are shown in the following way:
The histogram on the right shows the distribution of variants and you can select which of those are shown by drag and drop.
Add and remove single variants or reset the explorer.
Change the sorting of the variants on the right side.
Filter on the currently visible variants.
Click on single activities to create a selection on cases flowing through, not flowing through, starting with or ending with the activity.
Click on single edges to create a selection on cases with the connection or without the connection.
Change the KPI shown on the explorer.
Hide and show KPIs on the graph.
Switch to a list representation of the variants.
Variants
A variant is an end-to-end trace through the process' activities. Each case follows exactly one variant.
Throughput time search
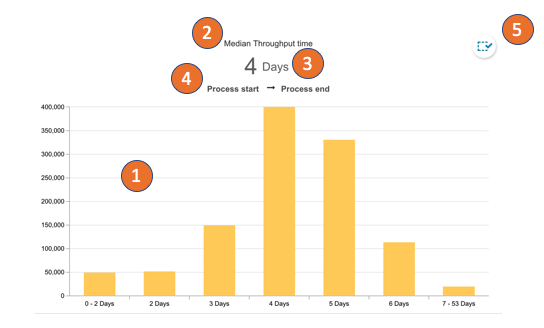 |
The throughput time search allows you to analyze the throughput times on your process' connections.
The histogram shows the case distribution on the edge's throughput time. Click and drag to select and drill down.
Click on the calculation method and change it between: Median, average, trimmed mean, maximum and minimum.
Click on the unit to change between: days, hours, minutes and seconds.
Click on the activity names to select the start and end activity for the throughput time calculation.
Click on the selection icon and set a crop selection for the currentl- chosen activities.
Activity search
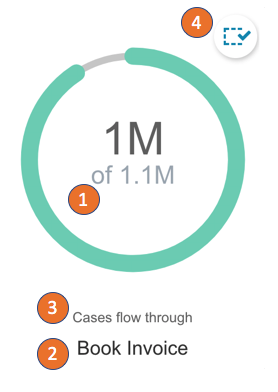 |
The Ativity Explorer shows detailed information on single activities.
The chart shows the coverage of the activity compared to the total event log.
Click on the activity name to select from all activities in the event log.
Click on the metric to change between: Cases flow through, cases don't flow through, cases start with and cases end with.
Click on the selection icon to select all cases currently covered with the components ratio.